Chapter 4: Architecture Design
Typical system topology, zone architecture, equipment cabling, and capacity planning
4.1 Typical System Topology
The reference topology organizes the log security system into three distinct security zones, each with its own trust boundary and network policy. This three-zone model is the minimum recommended architecture for any deployment that must satisfy compliance or forensic requirements. The Production Zone contains log sources and zone collectors; the Security Operations Zone contains the ingest, processing, and search infrastructure; and the Audit & Compliance Zone contains the immutable evidence vault and integrity services. Communication between zones is strictly controlled through firewall rules and allowlists.
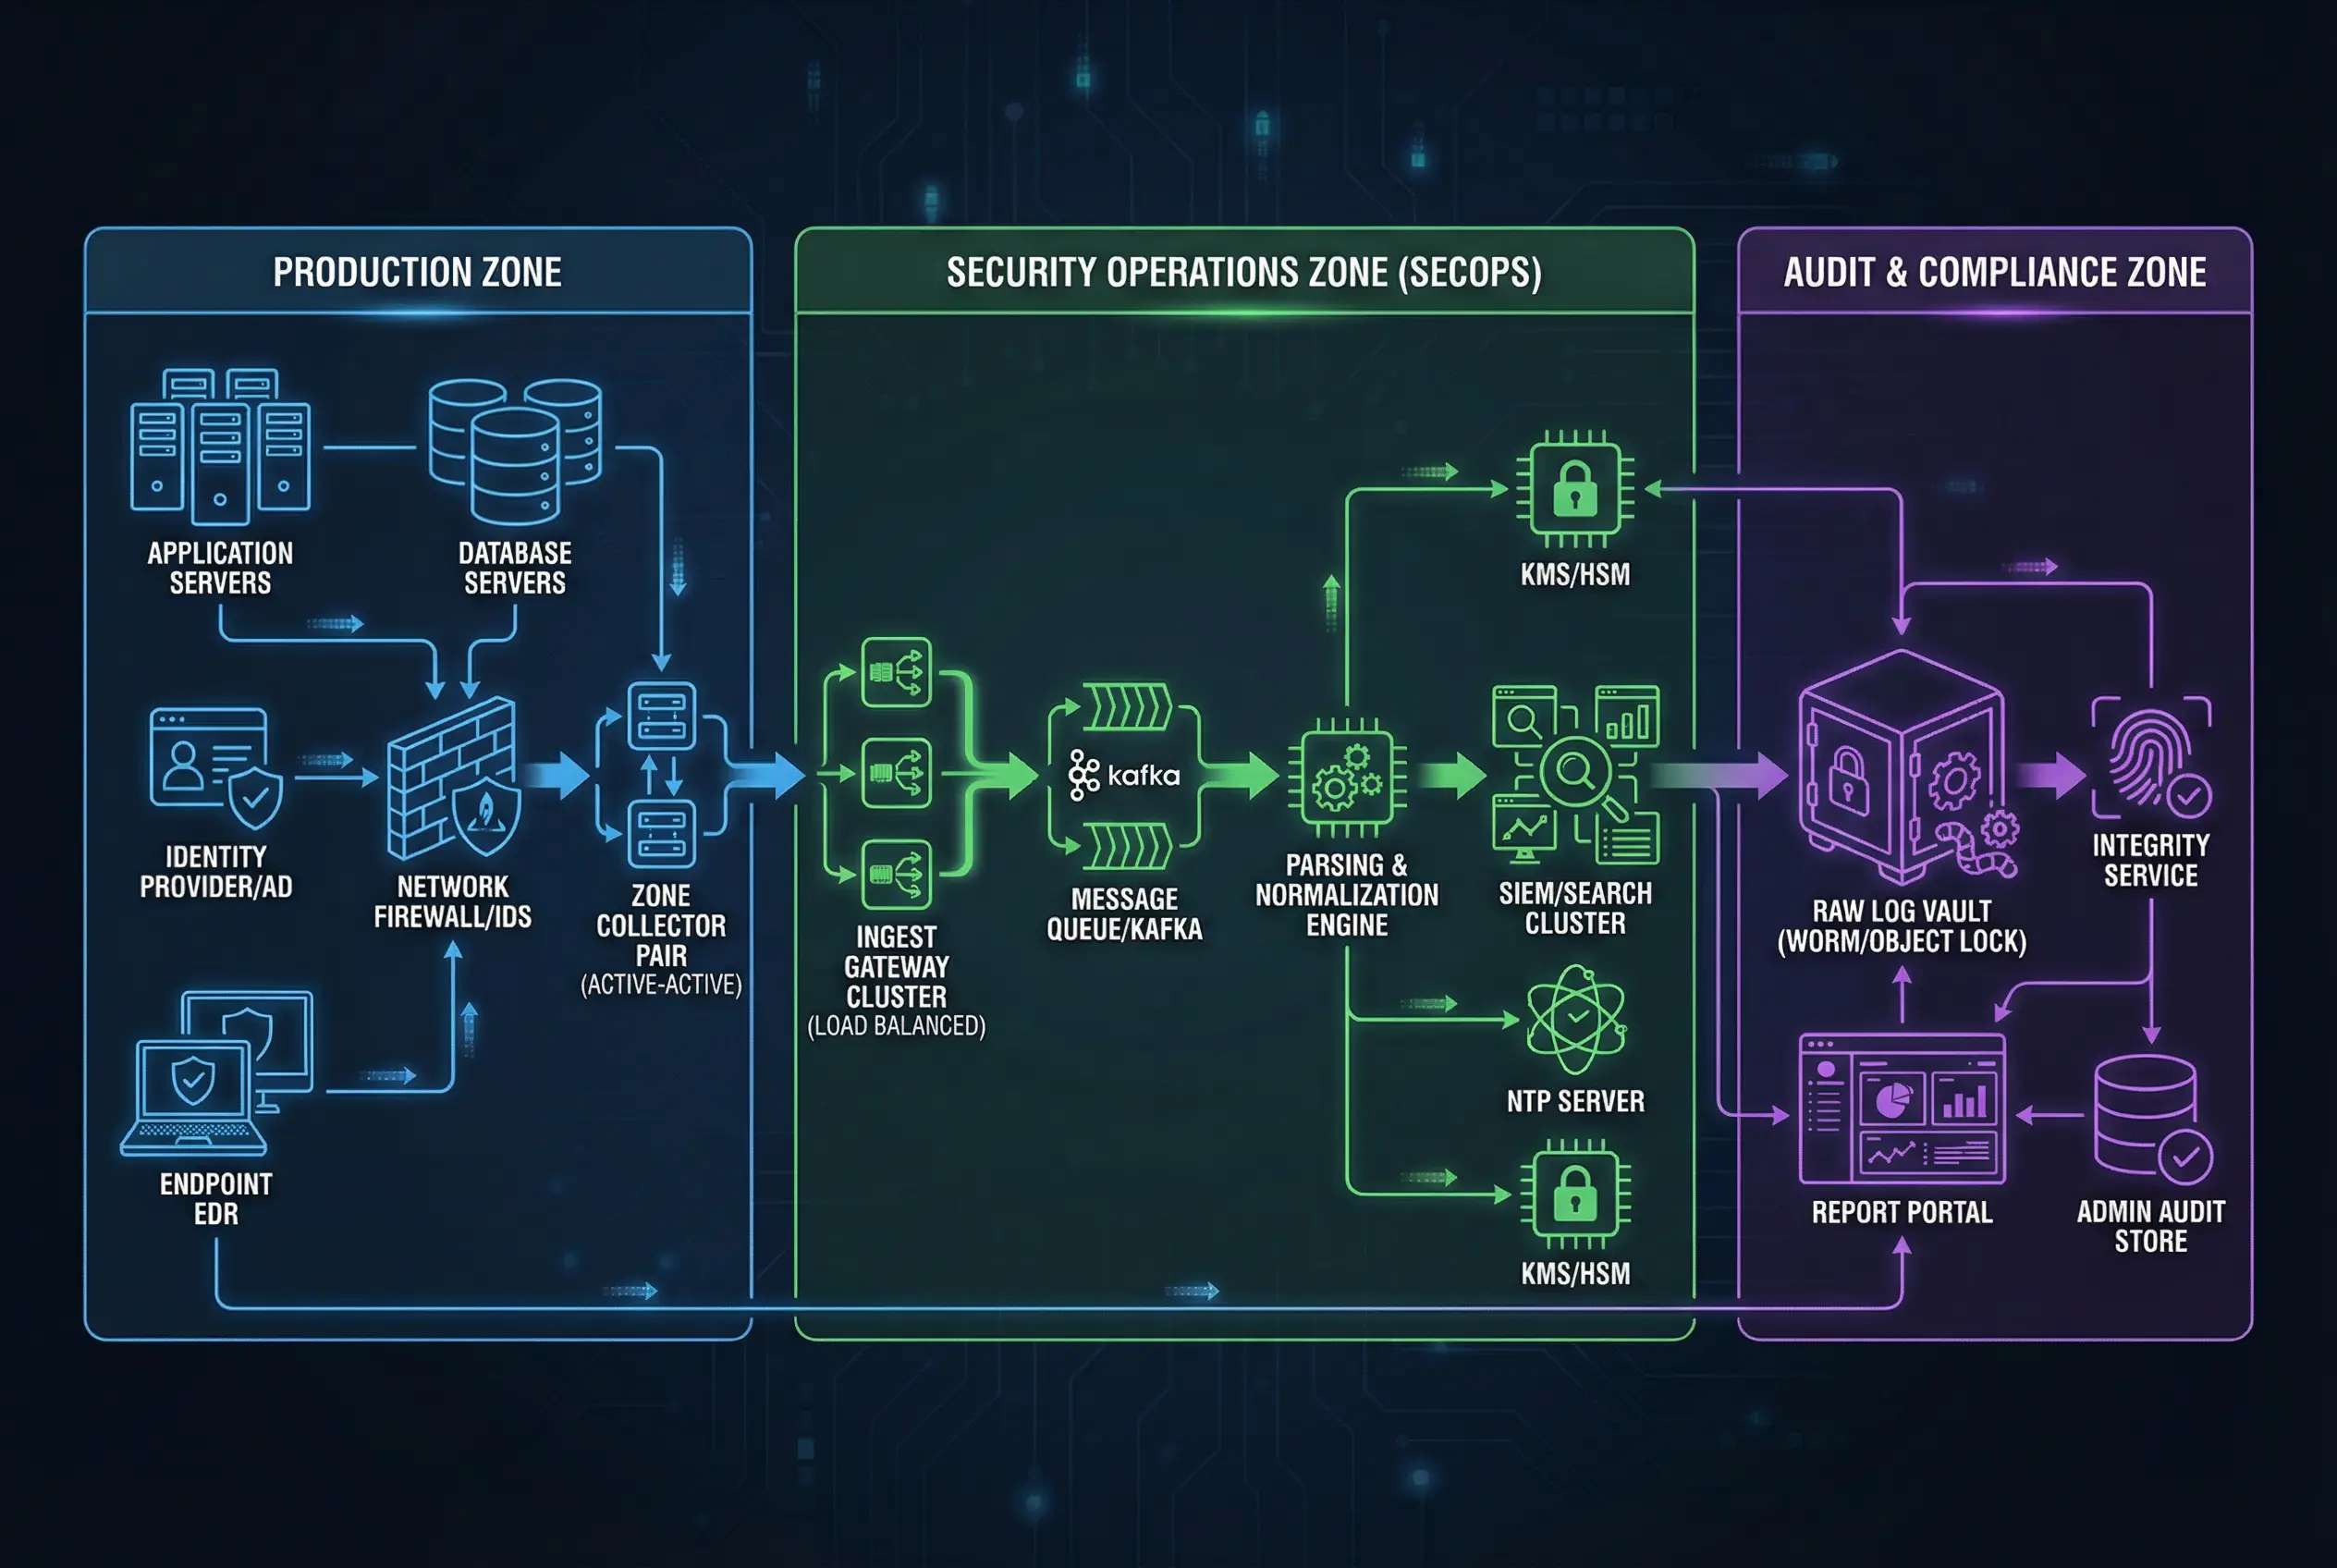
The topology diagram illustrates the complete data flow from log sources through the evidence chain. Log sources in the Production Zone generate events that are collected by the Zone Collector Pair (active-active configuration). The collectors forward log segments over mTLS to the Ingest Gateway Cluster in the SecOps Zone, which routes events through a Kafka message queue to the Parsing & Normalization Engine. From there, normalized events flow to the SIEM/Search Cluster for analyst access, while raw segments are simultaneously written to the Raw Log Vault in the Audit & Compliance Zone. The Integrity Service continuously verifies the hash chain of stored segments and produces verification manifests.
Production Zone (Blue)
- Application Servers
- Database Servers
- Identity Provider / AD
- Endpoint EDR
- Network Firewall / IDS
- Zone Collector Pair (AA)
SecOps Zone (Green)
- Ingest Gateway Cluster
- Message Queue / Kafka
- Parsing & Normalization
- SIEM / Search Cluster
- NTP Server
- KMS / HSM
Audit Zone (Purple)
- Raw Log Vault (WORM)
- Integrity Service
- Report Portal
- Admin Audit Store
- Evidence Export Gateway
| Zone | Trust Level | Inbound Allowed From | Outbound Allowed To | Key Firewall Rules |
|---|---|---|---|---|
| Production | Low (untrusted sources) | Log sources (internal) | SecOps Zone (mTLS 6514) | Block all inbound from SecOps; allow outbound to ingest GW only |
| SecOps | Medium (operational) | Production Zone (mTLS 6514) | Audit Zone (raw write only) | No direct access to Audit Zone admin; analysts access via RBAC portal |
| Audit | High (evidence) | SecOps Zone (raw write pipeline only) | Report Portal (read-only export) | No delete/modify from any zone; dual control for admin access |
4.2 Equipment Cabling and Physical Connections
Physical cabling discipline is an often-overlooked aspect of log security architecture. Incorrect cabling can create unintended network paths that bypass security controls, allow unauthorized access to management interfaces, or create single points of failure that cause log loss. The reference cabling diagram shows the standard rack layout and cable routing for the core log security components, with color-coded cables to distinguish functional roles.
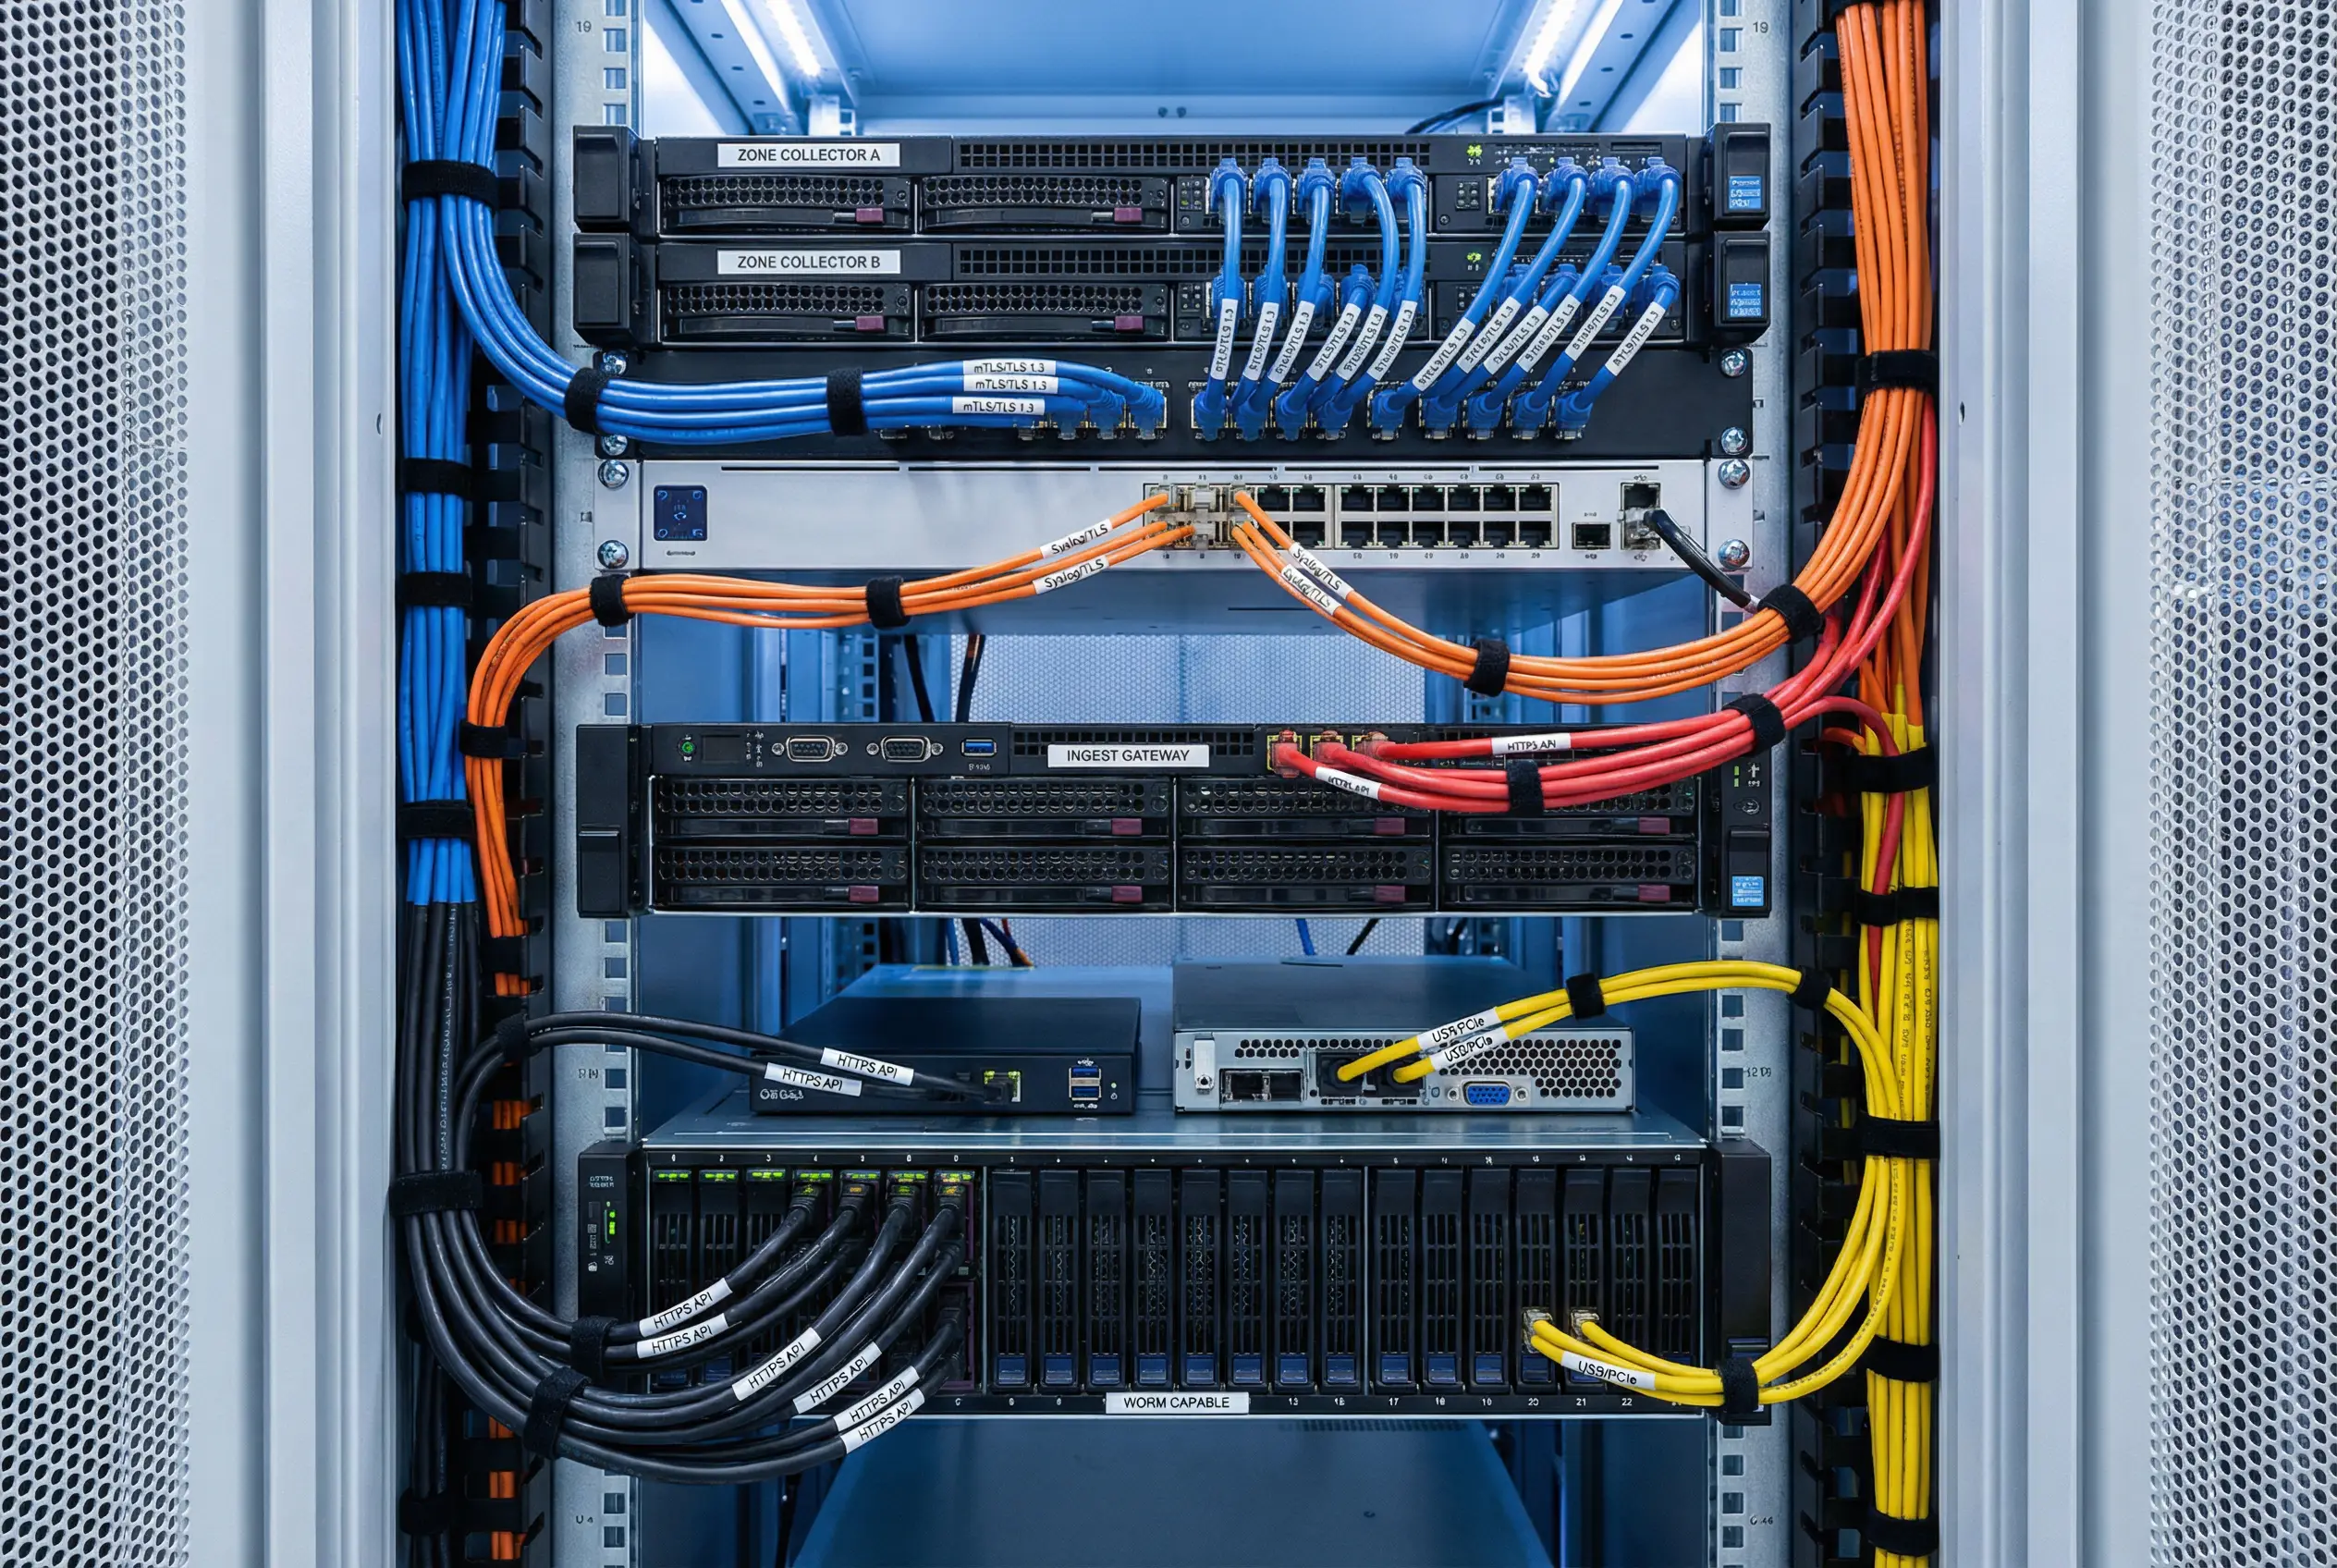
The cabling diagram uses a four-color scheme to distinguish cable functions: blue for data network connections (syslog/TLS and mTLS), orange for fiber optic high-speed connections (10G between collectors and ingest gateway), red for management network connections (HTTPS/SSH), and yellow for power and out-of-band management. Each cable is labeled with the protocol and port number at both ends to facilitate troubleshooting and audit. The Zone Collector A and B servers are connected to the managed switch with separate blue cables, and the switch connects to the Ingest Gateway servers via orange fiber optic cables for high-throughput log forwarding.
| Cable Color | Function | Protocol / Port | Connected Components | Notes |
|---|---|---|---|---|
| Blue | Data network | mTLS / 6514, Syslog/TLS / 514 | Sources → Collectors → Switch | Label both ends with protocol and port |
| Orange | High-speed fiber | 10G iSCSI / NFS | Switch → Ingest Gateway, Collectors → Storage | Use LC-LC duplex connectors |
| Red | Management network | HTTPS / 443, SSH / 22 | All appliances → Management switch | Physically separate from data network |
| Yellow | Power / OOB | IPMI / 623 | All appliances → OOB management switch | Connect to separate UPS circuit |
4.3 Capacity Planning and Sizing
Capacity planning for a log security system requires modeling three independent dimensions: compute (for parsing and indexing), network (for log transport), and storage (for raw evidence and index). These dimensions scale differently with EPS, log verbosity, and retention requirements. The table below provides reference sizing parameters for three deployment tiers commonly encountered in practice.
| Parameter | Small (<2,000 EPS) | Medium (2K–10K EPS) | Large (10K–50K EPS) | Notes |
|---|---|---|---|---|
| Zone Collectors | 1 pair (active-standby) | 1–2 pairs (active-active) | 3+ pairs per zone | Size for 2× peak EPS |
| Collector CPU | 4 vCPU / 8 GB RAM | 8 vCPU / 16 GB RAM | 16 vCPU / 32 GB RAM | Per collector instance |
| Collector Buffer Disk | 500 GB SSD | 2 TB SSD | 8 TB NVMe | 72h outage tolerance |
| Ingest Gateway | 2-node cluster | 3-node cluster | 5+ node cluster | N+1 redundancy |
| Raw Vault Storage (1yr) | 5–15 TB | 15–75 TB | 75–375 TB | Assumes 10:1 compression |
| Index Storage (90d hot) | 2–6 TB | 6–30 TB | 30–150 TB | Normalized events only |
| Network Bandwidth | 10 Mbps sustained | 50–250 Mbps | 250 Mbps – 1 Gbps | Add 3× burst headroom |
| Integrity Service | 1 instance (shared) | 1 dedicated instance | 2+ instances (HA) | Verify 100% of segments |
Sizing Rule of Thumb: Always size for 2× the expected peak EPS to accommodate burst events (security incidents, batch jobs, system reboots). Buffer disk should support at least 72 hours of log accumulation at peak rate to survive extended network outages. Storage estimates assume 10:1 compression ratio for cold archive; actual ratios vary from 5:1 (binary logs) to 20:1 (verbose text logs).